
My motivation for this post arose out of the hoopla I perceived concerning the wisdom attributed to Adam Corolla’s unreflective rant regarding the OWS movement. For the sake of open discussion, I’m going to disagree with some of his premise. I’ll summarize and reply to the two primary premises underlying his arguments in two separate posts.
You can view his rant here.
Argument 1: The 1% own 50% of the wealth. The 99% expect the 1% to pay for them. Carolla believes that the 1% deservedly earn 50% of the wealth because they have worked harder than the 99%. Because the 1% pay 50% of the taxes, the 99% are lazy and ungrateful, leech off the wealthy tax dollars, and should work harder to increase their share.
My response to argument 1:
The 1% have not earned their 50% of the wealth, so to speak. Possessing wealth does not mean that it was earned “morally”, in the sense that you can earn wealth by exploiting people, which I maintain to be the case, or you can inherit it, in which case it is not earned at all. Furthermore, if the 99% had more of the wealth, they would be paying a greater percentage in taxes. It is not as though the 1% are charitably paying taxes. They pay the portion of taxes they due because of the current graduated tax structure which requires people with greater income to pay more taxes, which I should mention has decreased significantly in recent years.
My rational for Argument 1:
My response is based on a few premises: Economic growth requires that (1) firms maximize profits and (2) increase net assets. The consequence of these two motives for economic growth is that firms have an incentive to keep wage rates low, keep their tax rates low, and pay themselves as much as possible.
My first point relates to the fact that firms always have an incentive to pay as little as possible to produce their good or service. To explain this I’ll need to establish some basic economic theory. If this gets too abstract I apologize. I’ll summarize after the fundamentals are laid out so you can skip down to my second point which relates to the process of capital accumulation through capital concentration and centralization.
Regarding Wages
Firms have one objective: profit maximization. This can achieved in two ways: maximize outputs or minimize inputs. The general rule in a perfectly competitive market is that a firm maximizes profit by producing a quantity of output where marginal revenue equals marginal costs. There are a variety of methods to determine profit maximization, specifically the “total revenue–total cost method” which relies on the fact that profit equals revenue minus cost, and the “marginal revenue–marginal cost” method is based on the fact that total profit in a perfectly competitive market reaches its maximum point where marginal revenue equals marginal cost.
But the profit maximization issue can also be approached from the input side. That is, what is the maximum profit achieved by each input variable? This can be done by reducing the input costs of the commodities and production processes. When competition has reduced the cost of commodity inputs to their lowest possible threshold, a firm can increase technology or decrease variable inputs, such as wages.
The firm then increases inputs until the marginal revenues equal marginal costs, where marginal cost is the change in total cost that arises when the quantity produced changes by one unit. Assuming that a firm has minimized all inputs but labor, we mathematize this profit maximizing rule as MRPL = MCL . The marginal revenue product (MRPL) is the change in total revenue per unit change in the variable input assume labor. We can write this as MRPL = ∆TR/∆L, where MRPL is the product of marginal revenue, ∆TR is the change is total revenues, and ∆L is the change is labor inputs.
In order to maximize profits and maintain competitive prices (producing at a price lower than competitors), a firm needs to decreases prices, yet maximize revenues and maintain output. In this way P = MC (price equals marginal cost). We denote marginal cost as MC = W/MPL or the wage rate divided by the marginal number of units, where MPL is the change in output that results from employing an added unit of labor. Given this, we can derive MRPL=MC= P = W/MPL, which implies MPL = W/P. But all this assumes ceteris paribus and a constant wage rate where they receive a wage rate exactly equal to marginal product of labor, which in the short run is the case, but in the long run wage rates are not fixed. We see that increasing wage rate increases marginal costs, increasing prices, and making a firm’s product less competitive. In this way by decreasing wage rates, marginal costs are decreased showing that firm has an incentive to decrease the wage rate as low as possible in order to maximize profits.
In essence, to succeed in a free market economy, a firm eliminates competition by offering products at a lower price or consolidating business and buying competing companies out.
Below is a graph that elucidates the reality of this situation. Productivity, CEO pay, and corporate profits have risen exponentially, while production workers pay has increased marginally, not even keeping pace with the consumer price index, and inflation adjusted federal minimum wage has dropped even below the 1990 rate.
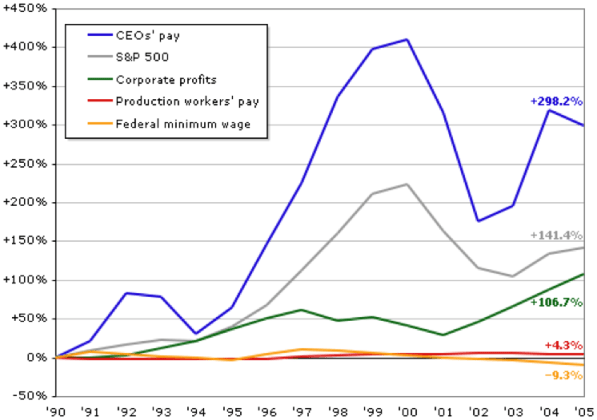
Again, a graph showing productivity and inflation-adjusted wages:

- Sources: US Department of Labor, Bureau of Labor Statistics; US Department of Commerce, Bureau of the Census, Historical Statistics of the United States. Jason Ricciuti-Borenstein produced this graph.
Regarding Capital or Wealth Accumulation
Recall the statement: The rich keep getting richer as the poor keep getting poorer. Well, that’s a reality in unchecked capitalist societies. It has much to do with the concept of compounding interest.
The rate at which capital is accumulated is defined as the value of the real net increase in the stock of capital in an accounting period, and the proportion of realized surplus-value or profit-income which is reinvested, rather than consumed. In this way, the lower the amount of profit-income that is spent as personal earnings and consumed, the lower the savings rate (investment) and therefore the lower the rate of capital accumulation. It’s easy to see that when you make very little, you spend and consume a greater portion of your income, if for nothing else than for the survival necessities. So, the greater portion that is saved, the greater the rate of captial accumulation.
When your compensation is disproportionately larger than your necessary consumption, you have much more to save (invest) and therefore your rate of capital accumulation is much greater. In general, the larger the total sum of capital investment, the more capital one borrow and reinvest at a greater rate of return, and therefore the higher the return on investment. Thus we can explain how the inequality gap between the wealthy and poor continues expanding.
When a society experiences economic flourishing, investment growth is cumulative and one investment in value-added production leads to another as markets constantly expand simultaneously with labor force and increase standard of living. This makes sense. When a society experiences economic stagnation, income from value-added production activities declines, and investment increasingly orients towards investments on military and security forces, real estate, financial speculation, and luxury consumption. (Does that sound familiar?)
Some theorist state that capital accumulation is a two fold process occurring in the total capital of a society. They state that within this total capital, there is the necessary product and the surplus product which is divided between spending and investment. In this way we see an economic tension that extends beyond commercial factors as the wealthy and compete with the wealth for surplus, the poor compete with the poor for necessities, and the wealthy and the poor compete for higher wages from surplus.
Examine the following graphs that show wealth distribution:


Karl Marx summarized the process of capital accumulation and its concentration and centralization nicely:
“It is concentration of capitals already formed, destruction of their individual independence, expropriation of capitalist by capitalist, transformation of many small into few large capitals…. Capital grows in one place to a huge mass in a single hand, because it has in another place been lost by many…. The battle of competition is fought by cheapening of commodities. The cheapness of commodities demands, caeteris paribus, on the productiveness of labour, and this again on the scale of production. Therefore, the larger capitals beat the smaller. It will further be remembered that, with the development of the capitalist mode of production, there is an increase in the minimum amount of individual capital necessary to carry on a business under its normal conditions. The smaller capitals, therefore, crowd into spheres of production which Modern Industry has only sporadically or incompletely got hold of. Here competition rages…. It always ends in the ruin of many small capitalists, whose capitals partly pass into the hands of their conquerors, partly vanish.”
-Karl Marx, “Das Kapital”, vol.1, ch. 25
While I’m not a self-identifying Marxist by any means, I agree with his formulation of capital concentration and centralization, especially in light of my conviction that man’s driving force is, as Nietzsche referred it, the “will to power”.
My idea is that every specific body strives to become master over all space and to extend its force (–its will to power:) and to thrust back all that resists its extension. But it continually encounters similar efforts on the part of other bodies and ends by coming to an arrangement (“union”) with those of them that are sufficiently related to it: thus they then conspire together for power. And the process goes on–
~from The Will to Power, s.636, Walter Kaufmann transl.[Anything which] is a living and not a dying body… will have to be an incarnate will to power, it will strive to grow, spread, seize, become predominant – not from any morality or immorality but because it is living and because life simply is will to power… ‘Exploitation’… belongs to the essence of what lives, as a basic organic function; it is a consequence of the will to power, which is after all the will to life.
~from Nietzsche’s Beyond Good and Evil, s.259, Walter Kaufmann transl.
Again, capital accumulation
“…Wakefield discovered that in the Colonies, property in money, means of subsistence, machines, and other means of production, does not as yet stamp a man as a capitalist if there be wanting the correlative — the wage-worker, the other man who is compelled to sell himself of his own free-will. He discovered that capital is not a thing, but a social relation between persons, established by the instrumentality of things. Mr. Peel, he moans, took with him from England to Swan River, West Australia, means of subsistence and of production to the amount of £50,000. Mr. Peel had the foresight to bring with him, besides, 3,000 persons of the working-class, men, women, and children. Once arrived at his destination, “Mr. Peel was left without a servant to make his bed or fetch him water from the river.” Unhappy Mr. Peel, who provided for everything except the export of English modes of production to Swan River!”
— Karl Marx, “Das Kapital”, vol.1, ch. 33
Below are charts that show national trends in a variety of areas. Take notice of the years. I would like to do more research on the legislation and laws passed between the years 1965-1980. During that time there appears to be a dramatic shift in financial, health, legislation, and debt trends. I’d like to examine the relationship between federal reserve, government policy and legislation, financial institutions, big business, and wealth trends.
Tax Rates
The marginal tax rate for tax earners has also been shrinking rapidly since the 1960’s.

For just tax% rates and revenues of top earners:


Considering the vast wealth in the USA, American’s Inheritance taxes are paltry when compared to other countries which further compounds the affects of capital accumulation and guarantees that future generations of privileged American’s retain wealth that they didn’t necessarily earn.

Wages
In the chart below real wages peaked in 1972 and reached a low in 2004 (While I do not know how wages how changed since 2004, I imagine the downward trend continued)
Wages and Benefits: Real Wages (1964-2004)
| REAL WAGES 1964-2004 Average Weekly Earnings (in 1982 constant dollars) For all private non-farm workers |
||
| Year | Real $ | Change |
| 1964 | 302.52 | |
| 1965 | 310.46 | 2.62% |
| 1966 | 312.83 | 0.76% |
| 1967 | 311.30 | -0.49% |
| 1968 | 315.37 | 1.31% |
| 1969 | 316.93 | 0.49% |
| 1970 | 312.94 | -1.26% |
| 1971 | 318.05 | 1.63% |
| 1972 | 331.59 | 4.26% |
| 1973 | 331.39 | -0.06% |
| 1974 | 314.94 | -4.96% |
| 1975 | 305.16 | -3.11% |
| 1976 | 309.61 | 1.46% |
| 1977 | 310.99 | 0.45% |
| 1978 | 310.41 | -0.19% |
| 1979 | 298.87 | -3.72% |
| 1980 | 281.27 | -5.89% |
| 1981 | 277.35 | -1.39% |
| 1982 | 272.74 | -1.66% |
| 1983 | 277.50 | 1.75% |
| 1984 | 279.22 | 0.62% |
| 1985 | 276.23 | -1.07% |
| 1986 | 276.11 | -0.04% |
| 1987 | 272.88 | -1.17% |
| 1988 | 270.32 | -0.94% |
| 1989 | 267.27 | -1.13% |
| 1990 | 262.43 | -1.81% |
| 1991 | 258.34 | -1.56% |
| 1992 | 257.95 | -0.15% |
| 1993 | 258.12 | 0.07% |
| 1994 | 259.97 | 0.72% |
| 1995 | 258.43 | -0.59% |
| 1996 | 259.58 | 0.44% |
| 1997 | 265.22 | 2.17% |
| 1998 | 271.87 | 2.51% |
| 1999 | 274.64 | 1.02% |
| 2000 | 275.62 | 0.36% |
| 2001 | 275.38 | -0.09% |
| 2002 | 278.91 | 1.28% |
| 2003 | 279.94 | 0.37% |
| 2004 | 277.57 | -0.84% |
Employment
The chart below shows unemployment rates of the last 25 years.

And since 1948:

The graph below shows how this recession is different from previous recessions.

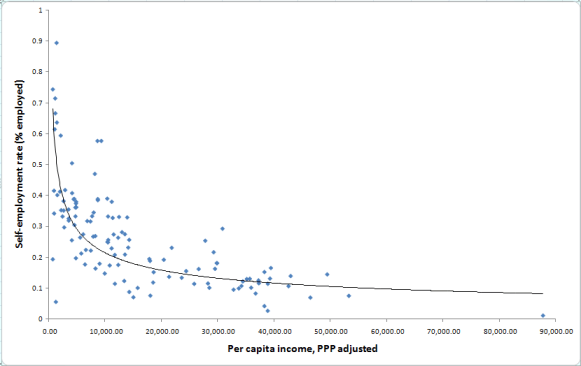
Some people would simply say that people should simply not depend on others for a job and just start their own company. There are many reasons why this is not so simple. The first reason is that barriers of entry are many times too great for a fledgling business, and competing with huge corporations with loads of capital and resources is no competition at all. The second reason is that big business is actually good for a country, so to speak. The larger the business, the larger the economies of scale, and the more efficient products can be produced and delivered, often at cheaper prices. The down side is that big business monopolizes the market, usually with only a handful of equally large competitors, and stifles competition.
The following graph shows relationship of how big business increases efficiency and increases GDP per capita. It indicates that countries with more self-employed workers have lower GDP per capita, while countries that have less self-employed workers have greater GDP per capita.
We can see a the consolidation of businesses in the US in many industries, from soft-drinks and fast-food, to banking and media.
Banking:

Media:

These mergers and acquisitions are undoubtedly good for the economy because they improve efficiency (See Self-employment: More may not be better)
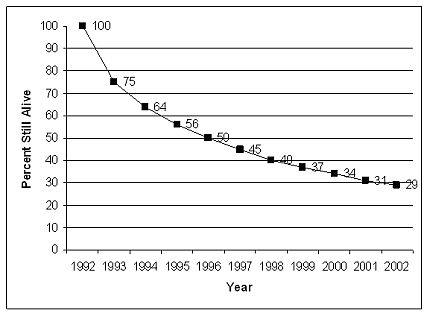
For those people who believe that people are lazy and should just go start their own business, research indicates that it’s more difficult than ever for startup’s to survive. This is due to the immense barriers of entry created by larger, more established companies. Examine the following graph:
Economic Inequality
The graph below indicates income trends of the top earners. Notice the steep incline in economic disparity beginning in the 1970’s.


Source: Striking It Richer. The Evolution of Top Incomes in the United States, by Emmanuel Saez, UC Berkeley
This graph shows that in 1995 tax rates for the 1% peaked and have continued declining.

Debt
See U.S. Household Deleveraging and Future Consumption Growth for more debt related charts. Debt levels began sky-rocketing in the 1970’s and peaked during the recent debt-implosion that caused the most recent US depression.


 Price Levels and Inflation This data shows that consumer goods have increased tremendously, even as real wages have remained stagnant. (For more see US Price Levels and Inflation Data)

- US Consumer Price Index Chart by YCharts

Hi and thanks for finding the time to describe the terminlogy for the beginners!